
R-multiples: how professionals talk about results
You made 340 dollars on one trade and lost 90 on another. Which one did you trade better?
You cannot answer that, and neither can anyone else, because dollars carry no information about what was at stake. The 340 might have come from risking 800. The 90 might have been a well-run trade on a 45 dollar risk that simply did not work.
R-multiples fix this by dividing every outcome by the amount you put at risk on that specific trade. It is the closest thing trading has to a common currency.
Defining R
R is your initial risk on that trade, in dollars: entry price minus stop price, multiplied by the size. Not your account risk percentage, not the position value. The planned loss.
Account 10,000 dollars, risk 0.75%, so R is 75 dollars.
A trade that hits your stop is minus 1R. A trade you close for a 225 dollar gain is plus 3R. A trade you exit early for a 30 dollar gain is plus 0.4R. A trade that gaps through your stop and costs 130 dollars is minus 1.73R, and recording that honestly is one of the more useful things a journal does.
Now the two trades from the opening are comparable. If the 340 dollar winner risked 850, it was plus 0.4R. If the 90 dollar loser risked 90, it was minus 1R. The "big winner" was a mediocre trade and the loser was a normal one.
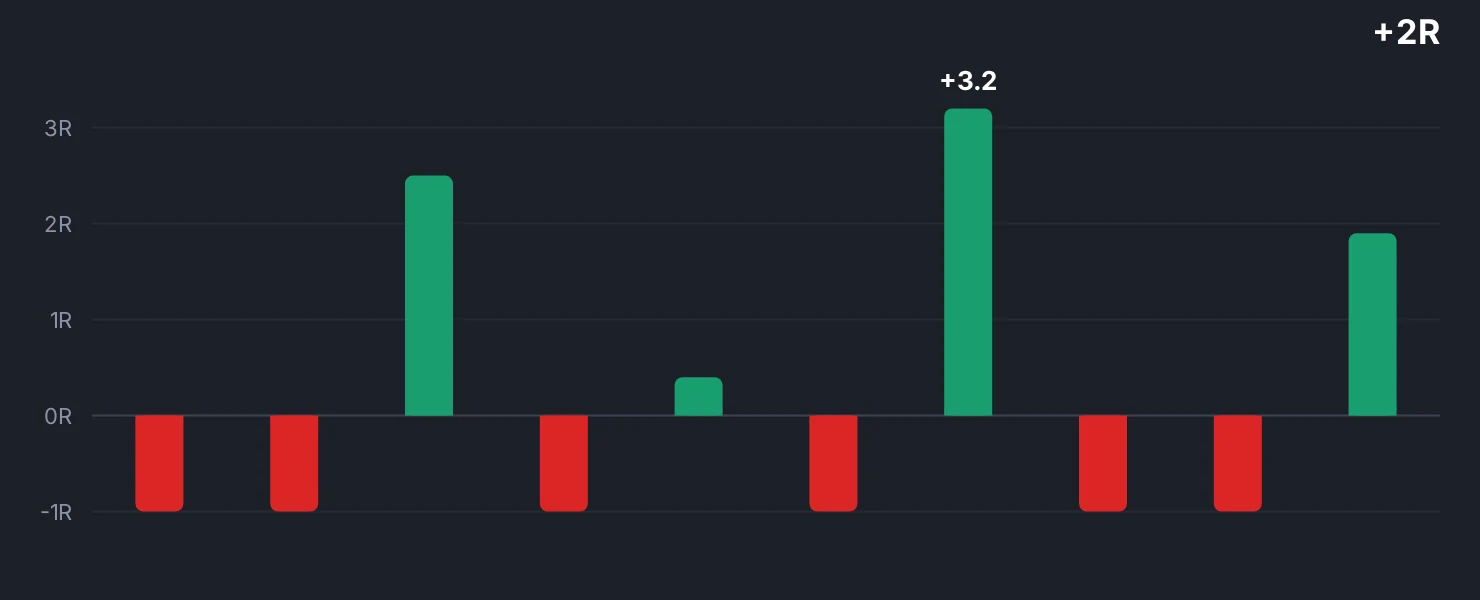
A real-looking ten-trade sequence
Here is a record in R:
-1, -1, +2.5, -1, +0.4, -1, +3.2, -1, -1, +1.9
Six losses, four wins. A 40% win rate. Most traders would describe that stretch as bad.
Add it up. The losses total minus 6R. The wins total 2.5 + 0.4 + 3.2 + 1.9 = plus 8.0R. Net: plus 2.0R across ten trades.
At 75 dollars per R that is 150 dollars, on a 10,000 dollar account, from a run where you were wrong more often than right. Scale the same behavior across 200 trades and it is 40R, which is where the compounding actually lives.
Notice what the R view exposes that a dollar view hides. Two trades, the +3.2 and the +2.5, produced 5.7R of the 8.0R total. Take those away and the sequence is minus 3.7R. Your results are usually a small number of large winners paying for a long tail of small losses, and R-multiples make that visible immediately.
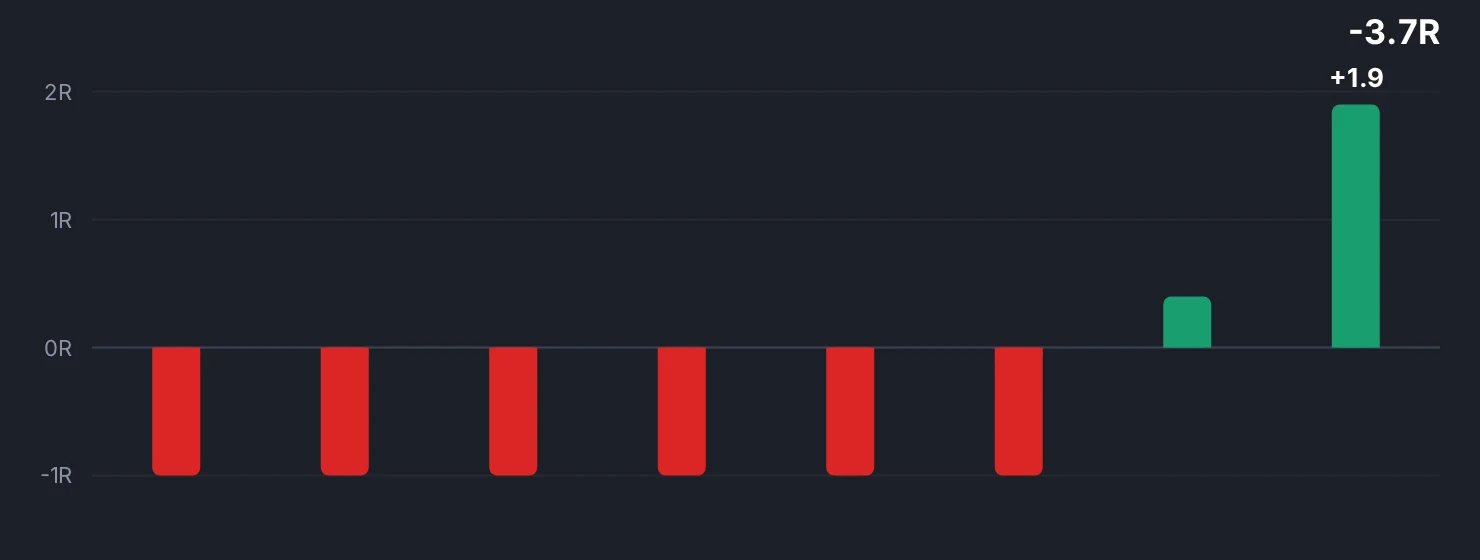
What R does to your reporting
Once results are in R, several things become measurable that were not before.
Average win and average loss. In the sequence above, average win is 8.0 / 4 = 2.0R and average loss is 1.0R. That ratio, together with the win rate, is your expectancy, which is the next lesson.
Comparison across instruments. A gold trade, a EURUSD trade and a small-cap trade all reduce to the same unit. You can finally ask which market your process actually works in.
Comparison across account sizes. Your record from when you traded 2,000 dollars is directly comparable to your record now. Dollars would tell you that you have improved when in fact only the balance changed.
Detection of a broken loss. If your average loss is 1.3R rather than 1.0R, you are not respecting stops. That single number catches widened stops, mental stops and slippage tolerance with no self-reporting required.
The traps
R is set at entry and never revised. If you enter with a 75 dollar risk and then trail the stop to break-even, the trade is still measured against 75 dollars. Recomputing R against the trailed stop makes every trade look like a huge multiple and destroys the metric.
Partial exits need a rule. If you scale out of half the position at plus 1R and the rest at plus 3R, the trade is plus 2R total, not plus 3R. Record the weighted result or your journal will flatter you.
R does not measure how long you held. Plus 2R in three days and plus 2R in five months are the same number and very different businesses. Log the holding period alongside it.
Indikora's journal records every closed trade in R and in the original currency, so the same trade can be checked against both the process and the account statement.
Why it changes behavior, not just bookkeeping
The practical effect of thinking in R is that a loss stops being an event. Minus 1R is the cost of participating, budgeted before the trade opened, identical in size to the last one and the next one. There is nothing to react to.
That is a smaller psychological benefit than it sounds until you have a losing week, and then it is the entire difference between reviewing a normal drawdown and abandoning a working process.
One R is the amount you risked on that trade, so every result becomes comparable no matter the instrument, the account size, or the stop distance.
Check yourself
Convert your last twenty closed trades to R, then check whether your average loss is bigger than 1.0R and how many of the total R came from your best two trades.
Trade journalIndikora has a free simulator, bar replay and a behavioral coach that reads your own trades.
Open the app