
Expectancy: why win rate alone tells you nothing
Every strategy sold on the internet leads with a win rate. Eighty-five percent accuracy. Nine winners out of ten. It is the most persuasive number in trading and the least informative one.
Here is why. A win rate describes how often you are right. It says nothing about what being right pays or what being wrong costs. Both of those are free variables, and a strategy can move them until an 85% win rate loses money reliably.
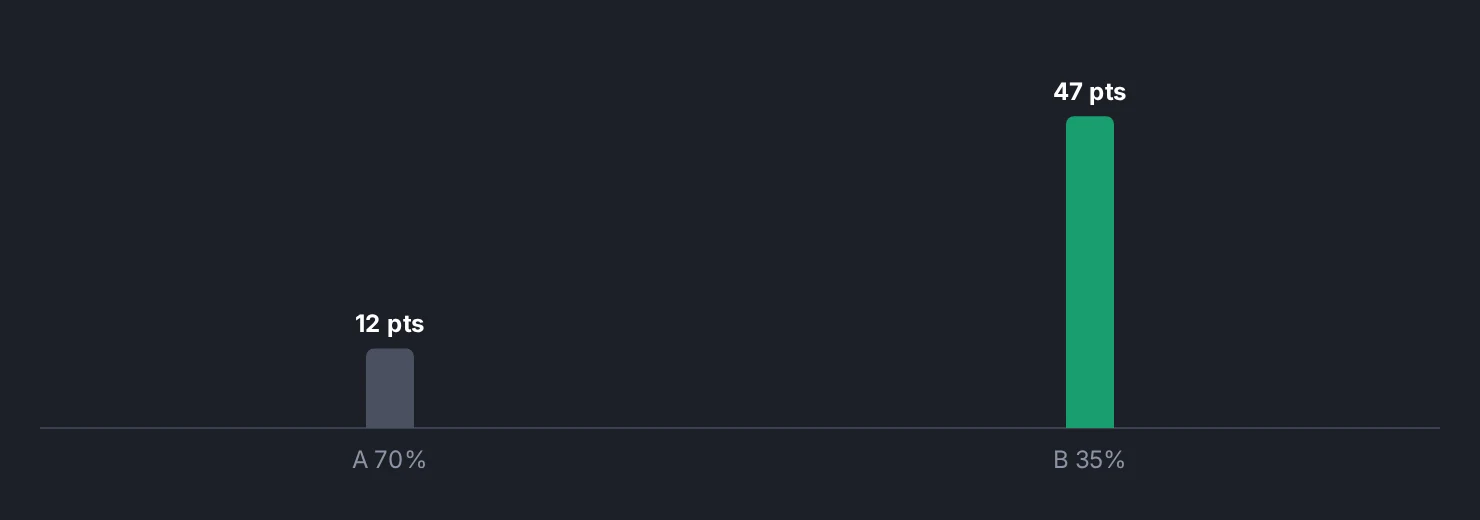
Two traders, one obvious winner, one actual winner
Trader A wins 70% of the time. Her average winner is 0.5R and her average loser is 1.4R, because she takes profit quickly and lets losers run past the stop a little.
Expectancy = (0.70 x 0.5) - (0.30 x 1.4) = 0.35 - 0.42 = minus 0.07R per trade.
Over 200 trades at 75 dollars per R, that is a loss of about 1,050 dollars, produced by a trader who is right seven times out of ten and feels like a genius most weeks.
Trader B wins 38% of the time. His average winner is 2.6R and his average loser is 0.95R, because he exits at the stop and does not interfere with winners.
Expectancy = (0.38 x 2.6) - (0.62 x 0.95) = 0.988 - 0.589 = plus 0.40R per trade.
Over 200 trades at 75 dollars per R that is roughly 6,000 dollars on a 10,000 dollar account, before compounding. He is wrong on nearly two out of three trades and spends most of his time looking incompetent.
The formula, and what each piece really is
Expectancy = (win rate x average win in R) - (loss rate x average loss in R)
Three inputs, and you control them to very different degrees.
Win rate is the input you control least. It is mostly a property of the market and the entry logic, and it moves around with regime. Traders spend nearly all their effort here.
Average loss is the input you control most. It should be 1.0R by construction, because that is what a stop is. If your journal says 1.25R, the gap is not bad luck, it is widened stops, mental stops and slippage, and closing it adds 0.15R of expectancy per losing trade with no change to your entries whatsoever.
Average win is where the leverage is. Moving average win from 2.0R to 2.6R at a 38% win rate adds 0.228R per trade. That is more improvement than most people get from a year of chasing better entries.
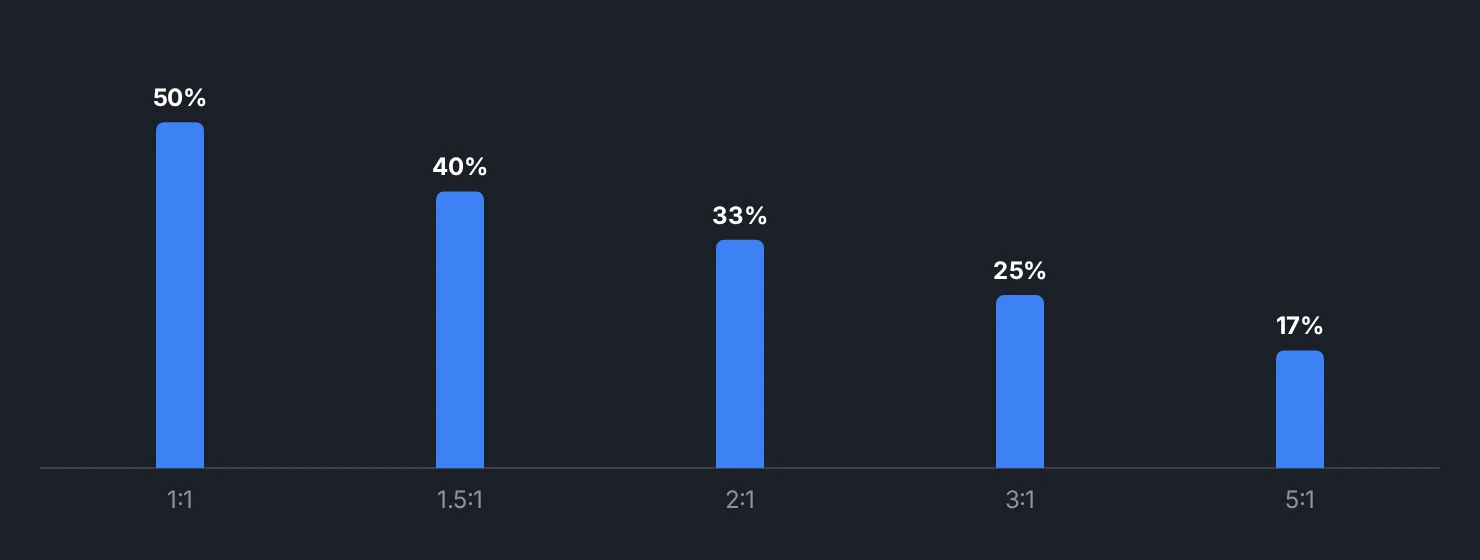
Break-even win rates, so you know what you need
For a given reward-to-risk, the win rate you need just to be flat is 1 / (1 + reward).
- 1R winners: 50.0%
- 1.5R winners: 40.0%
- 2R winners: 33.3%
- 3R winners: 25.0%
- 5R winners: 16.7%
This is the table that makes trend following make sense. A system that wins 30% of the time is a disaster with 1R targets and comfortably profitable with 3R ones. When someone dismisses a strategy for its low hit rate, they are missing the second column.
Note also that costs move these thresholds. If spread and commission eat 3% of every R, a 3R system needs about 25.8% rather than 25.0%. Small, but it compounds.
How many trades before you believe your number
This is where most traders deceive themselves. Trade-to-trade results are extremely noisy, with a standard deviation around 1.5R for a typical 3R-target system.
The uncertainty in your measured expectancy is roughly 1.5 divided by the square root of the number of trades.
After 30 trades: about 0.27R of noise. If you measured plus 0.4R, the honest range is roughly minus 0.14R to plus 0.94R. You cannot yet tell a good system from a broken one.
After 200 trades: about 0.11R. The range narrows to roughly plus 0.19R to plus 0.61R. Now you know the sign, if not the size.
A 30-trade sample proves almost nothing, in either direction. This cuts both ways: it is also why abandoning a system after eight losses is a statistical error, not discipline.
Indikora publishes probability calibration for exactly this reason. When a stated confidence of 60% is compared against what actually happened over a long chain of hashed, timestamped signals, the sample is large enough to mean something.
What to do with the number
Compute expectancy from your own journal, in R, over as many trades as you have. Then look at which of the three inputs is furthest from where it should be. If average loss exceeds 1.0R, fix that first, because it is the cheapest and most certain improvement available. If average win is below 1.5R while your losses are clean, the exit is cutting the trade off before the edge arrives.
A win rate on its own is a headline. Expectancy is the business.
Expectancy is what you make per trade on average, and a win rate quoted without the average win and average loss is not a result, it is a fragment.
Check yourself
Compute your expectancy from your last fifty journal entries, then recompute it with every losing trade forced to exactly minus 1.0R and note the difference.
Trade journalIndikora has a free simulator, bar replay and a behavioral coach that reads your own trades.
Open the app