
Drawdown: the price of admission
Every trader expects to lose sometimes. Almost nobody has actually looked at what a losing stretch costs, and the arithmetic is not intuitive in a way that has ended a lot of accounts.
Drawdown is the decline from an equity peak to the lowest point before a new peak. Not one bad trade, the whole valley. It is the part of trading that cannot be engineered away, only sized.
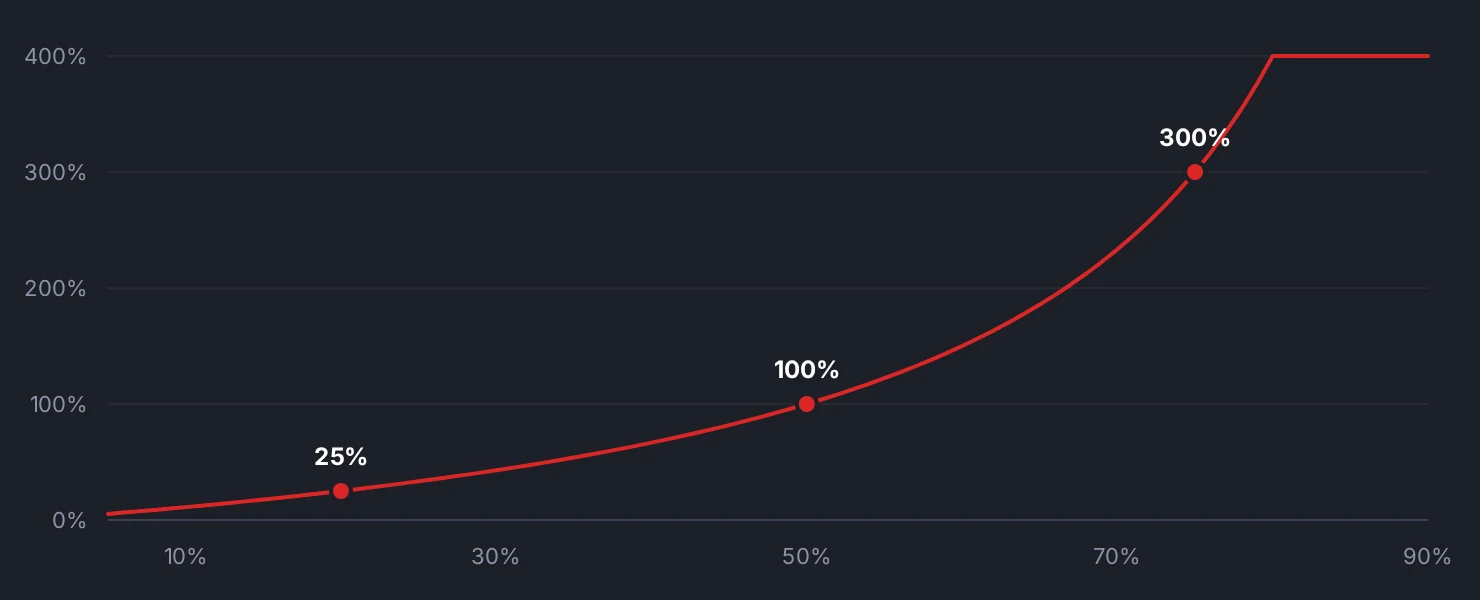
Losses and recoveries are not symmetric
If you lose 10% you need 11.1% to be flat. That feels fine. The gap widens fast.
- Down 5%: need +5.3%
- Down 10%: need +11.1%
- Down 20%: need +25.0%
- Down 30%: need +42.9%
- Down 40%: need +66.7%
- Down 50%: need +100.0%
- Down 70%: need +233.3%
- Down 90%: need +900.0%
The reason is that the gain is computed on a smaller base. Losing 50% of 10,000 leaves 5,000, and 5,000 has to double to get back. A 50% drawdown does not require an average year to fix, it requires the best year of most people's careers.
Below about 30%, recovery is a matter of patience. Above about 50%, recovery becomes a different problem than the one you were solving, and the temptation to size up to speed it along is what usually finishes the account off.
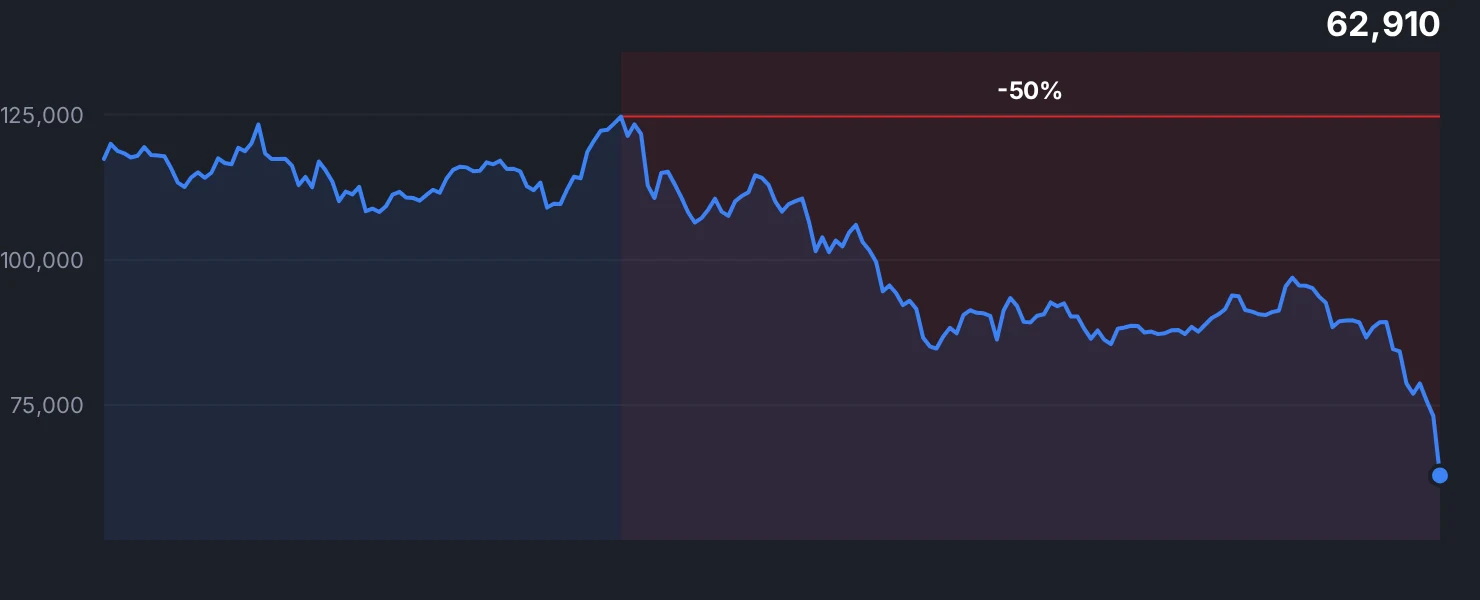
How long the climb actually takes
Say you have a genuinely good process: expectancy of plus 0.4R, risking 0.75% of equity per trade. Each trade is worth about 0.3% of equity on average.
To recover a 30% drawdown you need +42.9%. At 0.3% compounded per trade, that is about 119 trades.
To recover a 50% drawdown you need +100%. That is about 231 trades.
If you take four trades a week, 231 trades is over a year of flawless execution just to get back to where you were before. This is the real cost of a deep drawdown: not the money, the year.
Some drawdown is unavoidable, and its size is a setting
A positive edge does not prevent losing runs. It only makes them temporary.
At a 38% win rate, a six-loss streak is an ordinary occurrence. Six losses at 0.75% risk is about 4.4% of equity. But real drawdowns are rarely pure streaks, they are a mix of losses and small winners that fail to keep up. Across a 200-trade year, a system with plus 0.4R expectancy will commonly see a peak-to-trough valley in the region of 8R to 12R.
At 0.75% risk per trade, 8R to 12R is a 6% to 9% drawdown. Uncomfortable, entirely survivable.
Now change one setting. At 3% risk per trade, the same 8R to 12R is a 24% to 36% drawdown, on identical trades. At 5%, it is 40% to 60% and you are in the territory that takes a year to undo.
Drawdown depth scales almost linearly with risk per trade. Nothing about your analysis changed. The valley just got deeper because the step size did.
Depth is not the only thing that hurts
Three numbers describe a drawdown and traders only track one.
Depth is how far down you went. It determines the arithmetic of recovery.
Duration is how long you spent below the old peak. This is what actually breaks people. A 12% drawdown that lasts four months produces more abandoned strategies than a 20% drawdown that resolves in three weeks.
Frequency is how often you visit one. If you are underwater 40% of the time, that is normal for most systematic approaches and it needs to be known in advance rather than discovered.
The failure mode is predictable, and it is behavioral. Around week six of a flat-to-down stretch, the trader starts taking setups that are not in the plan, doubles size to "make it back faster", or abandons a working process one week before its winners arrive. Indikora's Coach labels decisions like these as revenge or overtrading based on the timing and context of the fill it observes, which at least puts a name on the pattern while it is happening.
Deciding your number before you meet it
The useful exercise is to pick, in advance and in writing, the drawdown at which you would stop and review rather than stop and quit. Somewhere below the level that would make you irrational and above the level your system routinely produces.
If your system's normal valley is 9% and you have decided that 25% triggers a full review, then everything between those two numbers is just weather. You already agreed to it. That agreement, made when nothing is at stake, is worth more than any indicator.
Losses and the gains needed to undo them are not symmetric, and the deeper the hole the more disproportionate the climb becomes.
Check yourself
Plot your equity curve from your journal, mark the deepest peak-to-trough valley in both percent and R, and write down the drawdown level at which you would pause and review.
Trade journalIndikora has a free simulator, bar replay and a behavioral coach that reads your own trades.
Open the app