
Momentum: measuring whether a move has legs
Somewhere early on, you were taught that RSI above 70 means overbought and RSI below 30 means oversold. It is the most repeated sentence in retail technical analysis, and it has probably cost more money than any other single idea, because it quietly turns a strength measurement into a reversal call.
Momentum indicators do not measure exhaustion. They measure speed. A market that is moving fast produces an extreme momentum reading for exactly as long as it keeps moving fast, which in a real trend can be months.
What momentum actually computes
Strip away the packaging and almost every momentum indicator is doing one of two things: comparing today's price with the price N bars ago, or comparing the size of recent up-moves with the size of recent down-moves.
Rate of change is the first kind. Price today divided by price 28 bars ago, minus one. Positive means the last 28 bars have net advanced. That is the entire calculation.
RSI is the second kind. It takes the average gain on up-bars and divides it by the total of average gain plus average loss, scaled to 0 to 100. A reading of 80 means recent bars have been overwhelmingly positive. It does not contain any information about what the next bar does.
The scale is what confuses people. Because RSI is bounded between 0 and 100, it looks like a gauge with a red zone. Price is not bounded. A stock or a currency pair can keep advancing while RSI sits pinned near the top for weeks, and every mean-reversion trade taken against it loses.
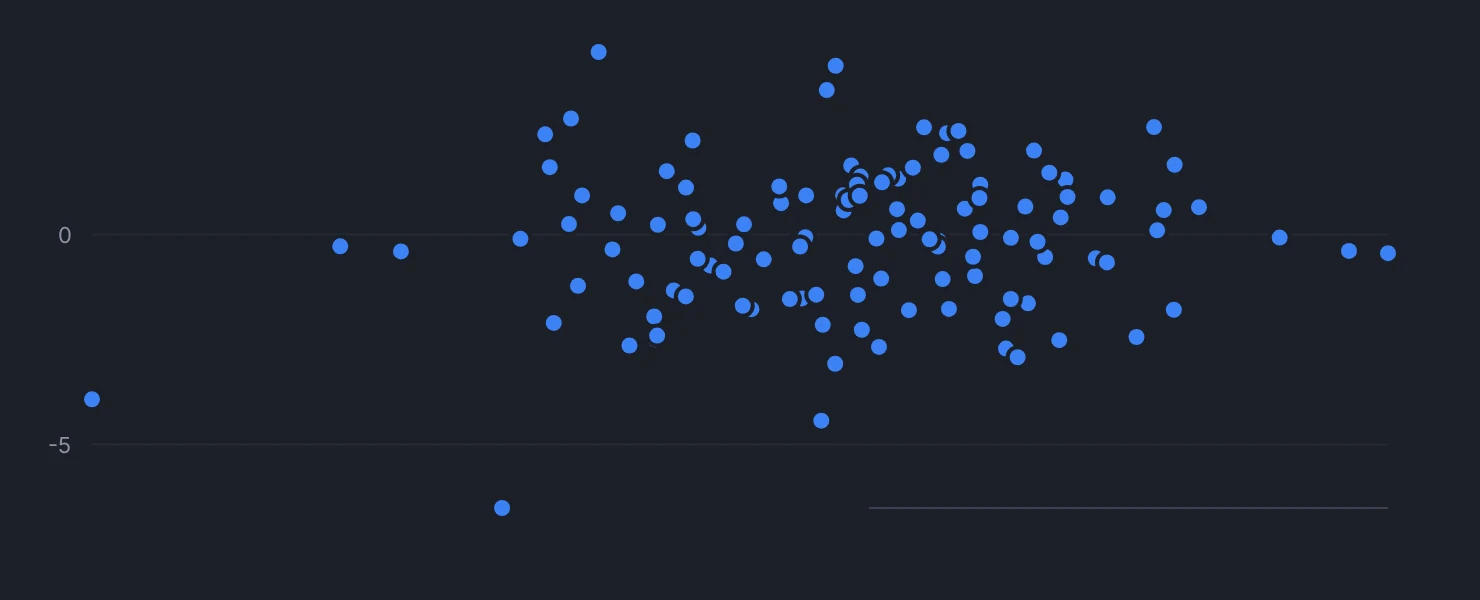
The trend-versus-range problem, again
Momentum oscillators work in ranges and fail in trends. Momentum readings work in trends and mislead in ranges. Those are two different uses of the same family of math, and mixing them is where most confusion comes from.
If a market is oscillating inside a band, extremes really do tend to revert, because there is no directional pressure and price keeps returning to the middle. If a market is trending, extremes are the signature of the trend itself, and fading them means repeatedly betting against the only force in the market.
So the useful question is never "what is RSI reading". It is "what kind of market am I in, and therefore does this reading mean strength or stretch". You cannot answer the second question with the indicator alone. That is a classification you make first, from the structure of price.
Divergence deserves more skepticism than it gets
Divergence - price makes a higher high while momentum makes a lower high - is presented as an early warning of reversal. It is one of the most seductive patterns on a chart because it looks like secret knowledge.
Divergence is common, reversals are rare, so most divergences resolve by momentum catching up rather than price turning down. Strong trends produce divergence continuously. A first thrust off a low is violent and prints a huge momentum reading, and every subsequent leg is calmer by comparison, which registers as divergence even while price keeps making new highs.
If you want to use divergence honestly, count it. Go through a year of one asset, mark every divergence, and record how many preceded a genuine change of trend versus how many were absorbed. The ratio is usually humbling.
The plain version is usually enough
Indikora measures momentum as a 28-day lookback on the daily timeframe, and uses it as a filter alongside price being above its SMA50. Both conditions true means the asset is in its own uptrend and is eligible for consideration. That is it - no smoothing chain, no signal line, no divergence logic.
The reason for keeping it plain is that momentum is a noisy measurement, and every extra transform on a noisy measurement adds parameters without adding information. MACD, for instance, is a difference of two moving averages with a third moving average on top. It is not a different concept from momentum. It is momentum with more knobs, and each knob is another chance to fit the past.
A single fixed lookback has one enormous advantage: you cannot quietly tune it after seeing results. The number is set before the test, and it either survives across assets or it does not.
What momentum genuinely tells you
It tells you whether the recent path has been net upward or downward, and roughly how forcefully. That is a real, useful, limited fact.
It does not tell you when the move ends. Nothing that reads only past prices does. Exits get handled by a separate mechanism - a volatility-based trailing rule, a level, a time limit - because asking a momentum reading to also time your exit is asking one number to do two incompatible jobs.
Treat momentum as a description of the present tense. The move is fast, or it is not. Whether it continues is a probability you manage with sizing and stops, not a certainty you extract from an oscillator.
Momentum measures how fast price is changing, so an extreme reading describes strength in progress rather than a reversal about to happen.
Check yourself
Step through one year of daily bars and log every momentum divergence you can find, then mark whether each one was followed by a trend change or by price continuing in the same direction.
Bar replayIndikora has a free simulator, bar replay and a behavioral coach that reads your own trades.
Open the app