
How Indikora decides an asset is trending
Ask ten traders whether an asset is trending and you will get ten answers, all of them delivered with confidence. One points at a chart that "clearly" goes up. Another says the trend broke last Tuesday. A third is looking at a 15-minute chart and a fourth at a weekly one, and they are describing different worlds while using the same word.
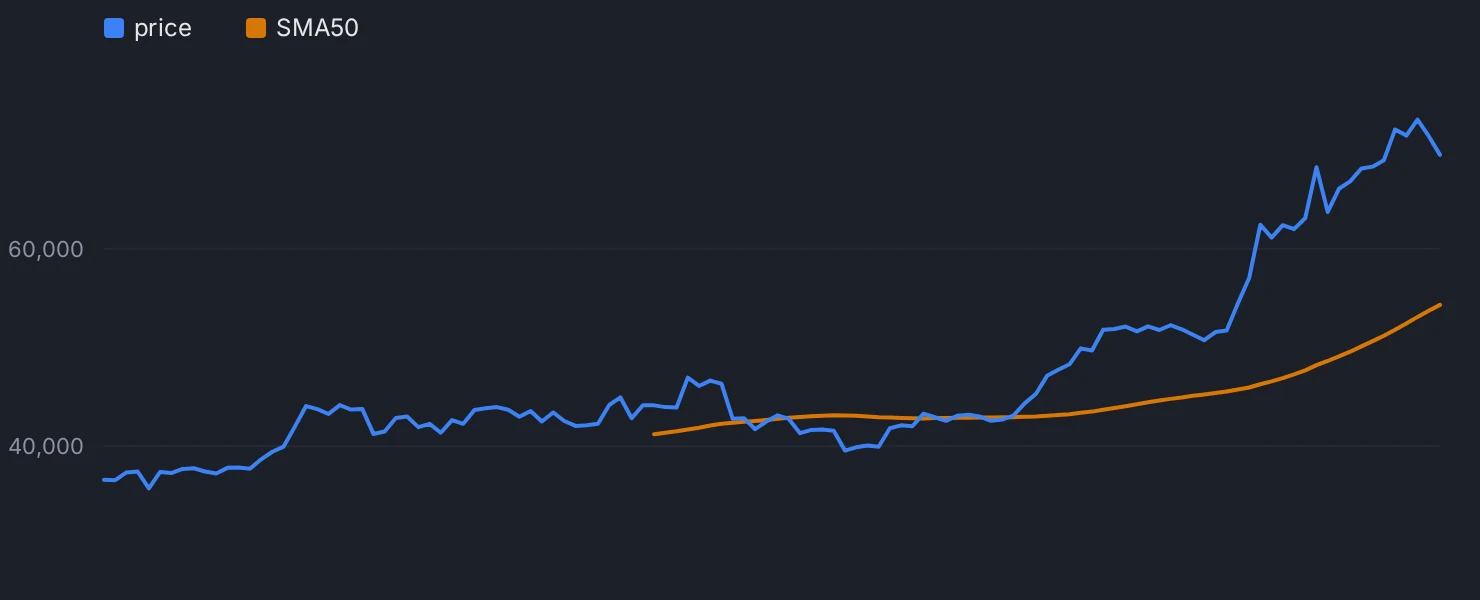
That ambiguity is fine in conversation and useless in software. An engine cannot act on "clearly goes up". It needs a definition that returns true or false on every asset, every day, without a human deciding what looks right. Indikora's definition is deliberately boring: on the daily timeframe, price must be above its 50-period simple moving average, and 28-day momentum must be positive. Both true, or the asset is not eligible.
Why the daily timeframe, and nothing faster
The timeframe is part of the definition, not a setting. The same rules on a 5-minute chart would produce dozens of state changes a week, most of them noise that reverses before you finish reading the alert.
A trend is a claim about persistence, and persistence needs time to be visible. Daily bars aggregate a full session of buying and selling into one data point, which throws away the intraday chop that makes fast charts look eventful.
The cost is real and worth naming. A daily definition cannot react to something that happens at 10am and unwinds by 3pm. If an asset gaps hard and reverses inside one session, the engine sees a single candle and shrugs. Anyone trading intraday will find the daily view unbearably slow, and they are not wrong about that. It is slow. That is the trade being made.
What SMA50 actually tests
A 50-day simple moving average is the average closing price of the last 50 sessions, recalculated each day. Price above it means today's price is higher than the recent average of prices. Nothing more mystical than that.
The moving average is a memory, not a prediction. It says where the asset has been trading, and the comparison tells you whether the current price is above or below that recent history. Fifty days is roughly ten weeks of trading, long enough that a single bad week does not flip it, short enough that a genuine multi-month change eventually shows up.
The weakness is structural. In a sideways market, price oscillates across its own average repeatedly, and the filter flickers between eligible and not eligible with no trend underneath it. Moving averages are only useful when there is direction to measure. When there is not, they generate a stream of technically valid, practically worthless state changes.
What 28-day momentum adds
Momentum here is the simplest possible version: is price higher now than it was 28 days ago. A yes or no, not a scaled indicator.
The second check exists because the first one can be satisfied by drift. Price can sit barely above a flat SMA50 for weeks while going nowhere. Requiring that price also be higher than four weeks earlier forces the move to have actually covered distance, not just hovered.
Requiring both conditions means the engine says no more often than it says yes. That is intentional. The failure mode being avoided is not "missed a good move", it is "entered forty things that were not moving". But the same strictness means a genuine new trend is never caught at the bottom. By the time price is above the 50-day average and higher than 28 days ago, a meaningful part of the move has already happened. Every trend filter buys reliability with lateness, and there is no version that does not.
What this definition is bad at
It is worth being explicit about the regimes where these rules cost you.
Sharp V-shaped reversals. The engine will be flat through the bottom and only becomes eligible well into the recovery.
Choppy ranges. Repeated eligible-then-not cycles, each one a potential entry that goes nowhere.
Slow grinding markets. An asset can rise steadily by a small amount and satisfy both checks while offering very little movement to work with.
The rules are also symmetric in a way that matters: they describe the asset's own uptrend, and nothing about whether the broader market supports it. That job belongs to a separate filter, covered later in this track.
Trend detection is not the interesting part of a system. It is the part that has to be mechanical so that the interesting parts have something stable to sit on. A definition you can state in one sentence, that returns the same answer for you and for the engine, is worth more than a cleverer one you cannot check.
An asset counts as trending only when price is above its SMA50 and 28-day momentum is positive, and that definition deliberately arrives late.
Check yourself
Pick one asset in bar replay and step forward day by day, marking on paper the exact bar where price first closes above SMA50 and the exact bar where 28-day momentum turns positive, then note how far apart they were.
Bar replayIndikora has a free simulator, bar replay and a behavioral coach that reads your own trades.
Open the app