
What a trend actually is
Ask ten traders to point at a trend on a chart and you get ten confident answers, and most of them are pointing at the same thing: the part of the chart that already went up. That is not a definition. That is hindsight with a ruler on top.
The word gets used as if everyone agrees on it, and the disagreement is expensive. If you cannot say in one sentence what would have to happen for the trend to stop existing, you do not have a trend definition. You have a mood.
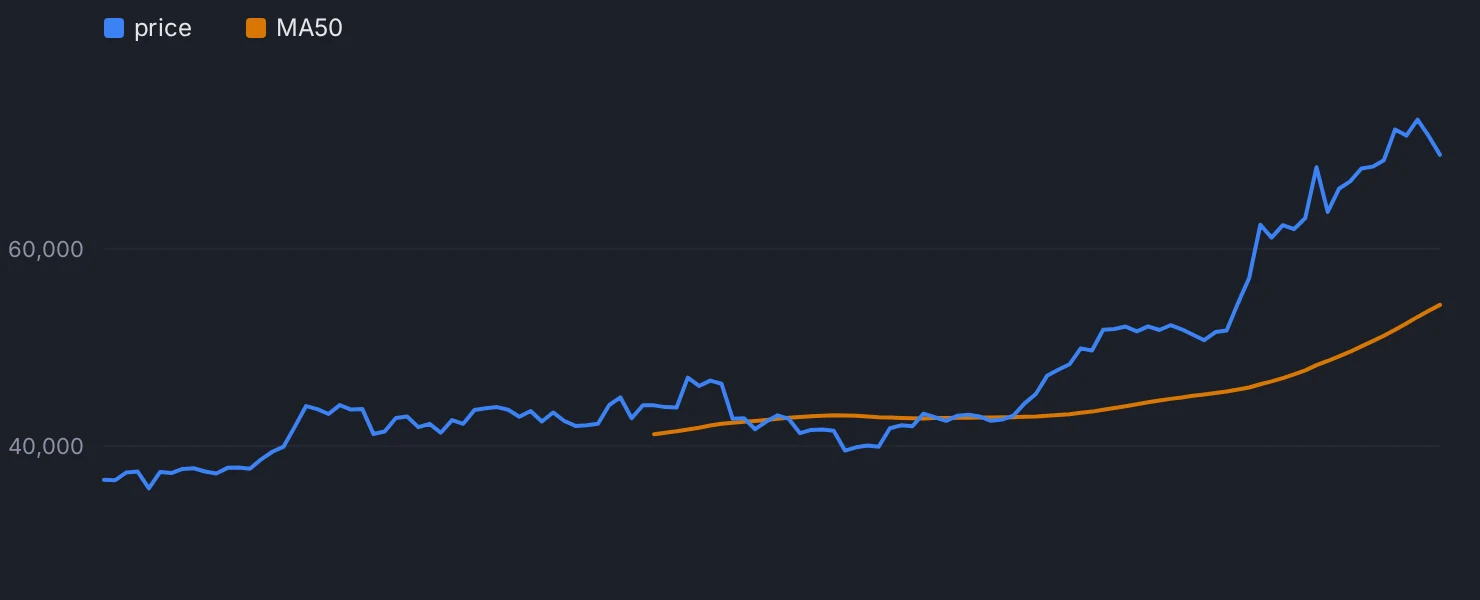
A trend is a rule, not a shape
The only useful definition of a trend is one you could hand to someone who has never seen the chart. They should be able to apply it and get the same answer you did, without knowing what you hope happens next.
The classic version is structural: an uptrend is a sequence of higher highs and higher lows. Price makes a peak, pulls back without breaking the previous low, then makes a peak above the last one. A downtrend is the mirror image. This works, but it needs a human to decide which peaks count, and humans decide in favor of the position they already have.
The mechanical version replaces judgment with arithmetic. Price is above a moving average of the last 50 days, and the price today is higher than it was 28 days ago. Both conditions are numbers. Neither cares about your entry.
Indikora measures trend exactly this way, on the daily chart: price above the 50-day simple moving average and 28-day momentum positive. When both are true, the asset is considered to be in its own uptrend and becomes eligible for further analysis. That is a filter, not an instruction.
Why one condition is not enough
A single rule is easy to fool, and it usually gets fooled at the worst moment.
Use only "price above the 50-day average" and you catch every violent bounce inside a bear market. After a long decline, the average is falling fast. Price only has to stop dropping for a couple of weeks to poke above it. The rule says uptrend. The chart says a dead cat with good timing.
Use only momentum and you get the opposite failure. An asset can be up over the last 28 days while still sitting far below a long, declining average, which means the recovery is real but small relative to the damage. Momentum alone also fires on a single gap day that drags the whole 28-day comparison with it.
Requiring both is not magic. It just means the asset has to be above a medium-term reference level and have actually traveled upward to get there. Most of the fake signals fail one of the two.
Trend is a property of a timeframe, not of an asset
"Is gold in an uptrend" is an incomplete question. Gold can be above its 50-day average on the daily and below its 50-period average on the 1-hour chart at the same instant. Both statements are true, and they are not in conflict, because they are measuring different windows.
This is where a lot of beginner confusion comes from. You read a daily-chart opinion, then open a 5-minute chart, see red candles, and assume someone is wrong. Nobody is wrong. You changed the measuring instrument. The lesson "Timeframes: why the daily chart lies less" goes into what that costs you.
Pick the timeframe your rule lives on and state it out loud. A trend definition without a timeframe attached is not a definition.
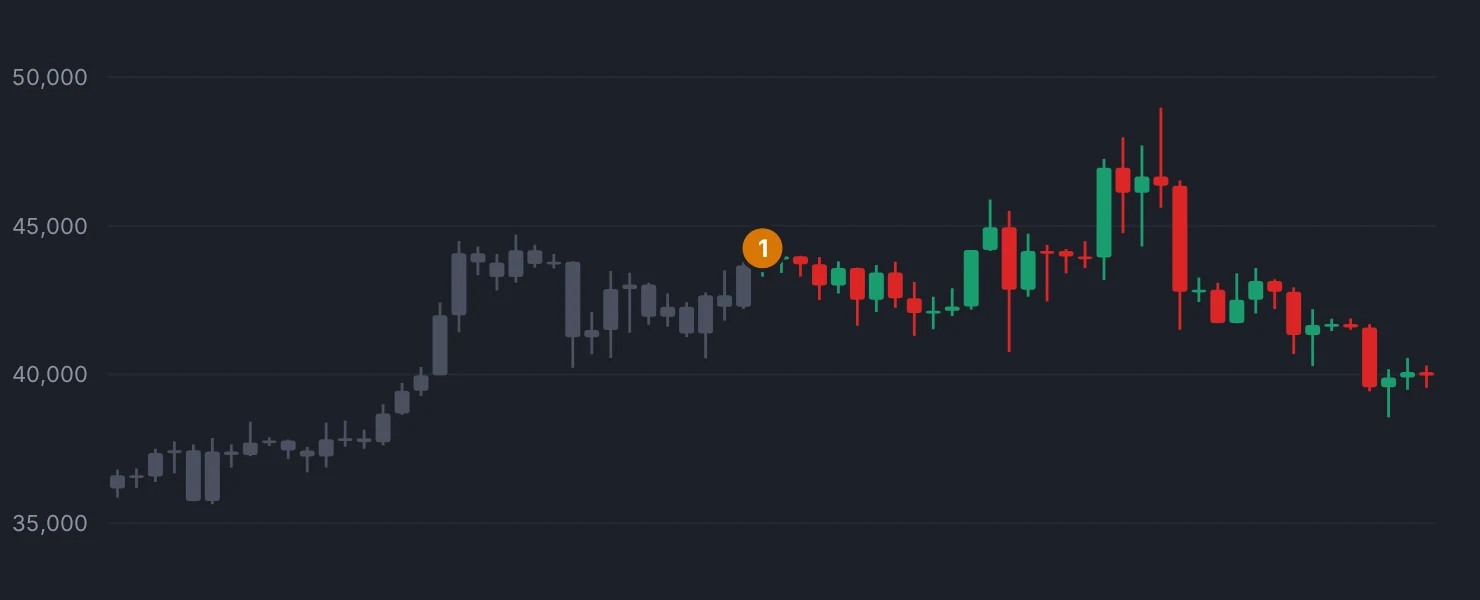
Every definition is late, and that is the price of objectivity
No rule tells you a trend ended until after it ended. A moving average is an average of the past. Momentum is a comparison to the past. By construction, they lag.
Traders try to fix this by making the rule faster, which does not remove the lag. It just makes the rule flip more often, so you get chopped in and out during the sideways stretches that make up most of a chart's life. The slow version is wrong late. The fast version is wrong often.
Because of that, a trend rule is usually not the same thing as an exit rule. Indikora, for example, uses the trend conditions to decide what is eligible, and a separate chandelier stop for exits: the highest price reached since entry, minus three times the average true range. The trend defines the universe, the stop defines the risk.
The practical shift is small and it changes everything. Instead of looking at a chart and asking "does this look strong", you look at it and ask "does this pass". One question has an answer that survives contact with tomorrow. The other one does not.
A trend is a rule you can check before the fact, not a shape you recognize afterward.
Check yourself
Replay six months of any asset one bar at a time and mark the exact date your written trend rule turned on and off, without editing the rule as you go.
Bar replayIndikora has a free simulator, bar replay and a behavioral coach that reads your own trades.
Open the app