
Moving averages: what they can and cannot tell you
You have seen the chart. Two colored lines wander through the candles, they cross somewhere near the middle, and a caption announces a golden cross as if something has been revealed. The implication is that the crossing caused the move that follows. It did not. The lines are arithmetic performed on prices that already printed, and arithmetic does not push a market anywhere.
That is not a reason to throw moving averages out. It is a reason to be precise about what they do, because the gap between what they measure and what people believe they measure is where most bad trading education lives.
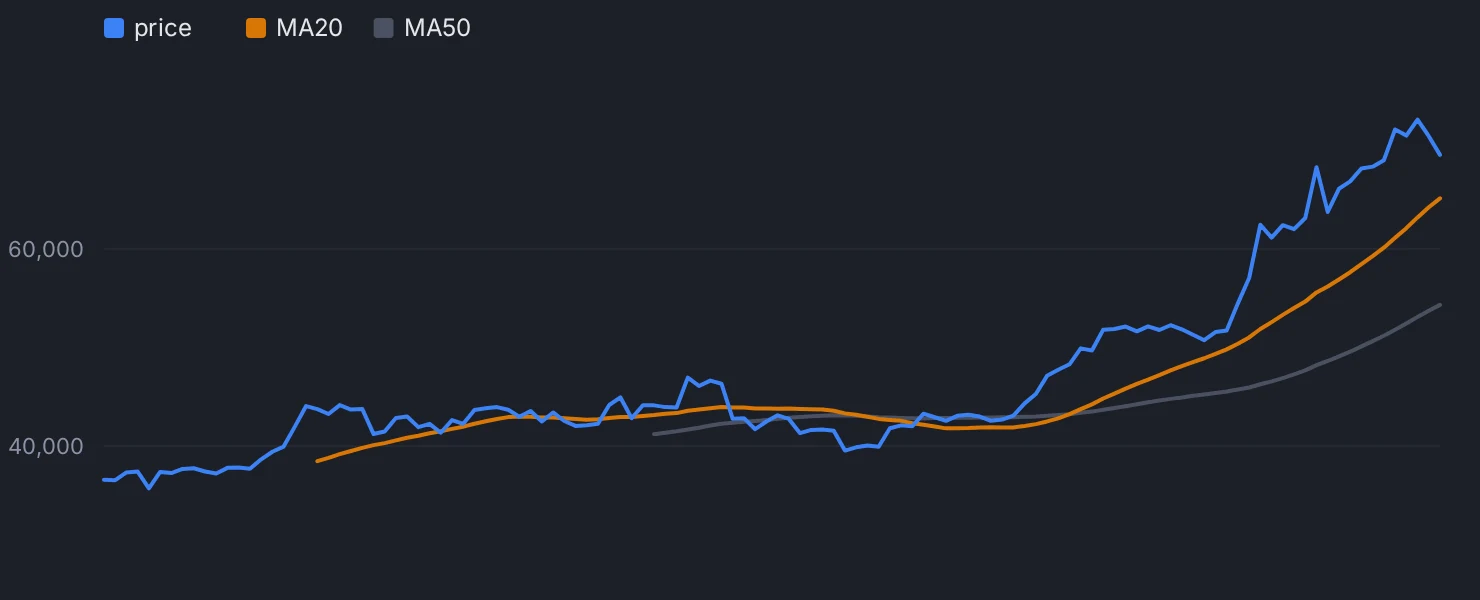
A moving average is a delay line
A simple moving average is the mean closing price of the last N bars, recalculated on each new bar. A 50-day SMA printed today contains prices from up to 50 days ago, weighted exactly the same as yesterday's close.
That makes lag a feature of the definition, not a flaw in the setting. You cannot tune it away. A shorter average reacts faster because it forgets faster, which means it also flips direction on noise. A longer average is calmer because it is more stubborn, which means it confirms turns long after they happened. You are choosing where on that trade-off to sit, not choosing between a lagging tool and a leading one.
This is why crossover systems feel so frustrating. By the time a 50 crosses a 200, the move that caused the cross has usually been running for weeks. The cross is a summary of the past, published late.
What they are genuinely good at
Moving averages are good at classification, not timing. Asking "is price above or below its 200-day average" is a crude but stable question. It changes answer rarely, it means roughly the same thing across assets, and it can be checked mechanically without judgment.
That stability matters more than it sounds. Most retail decisions are inconsistent from day to day. A rule like "price above SMA50 on the daily" is not clever, but it is repeatable, and repeatable beats clever when you are the weak link.
They are also useful as a shared reference point. Many participants watch the same round-number averages, so price often reacts around them. That is not magic in the line, it is other people's orders clustered near an obvious level. The distinction matters: if everyone stops watching, the level stops working.
Indikora uses this narrowly. An asset is only eligible when daily price is above its SMA50 and 28-day momentum is positive. The average is used as a filter for whether an asset belongs in the conversation at all, not as an entry trigger.
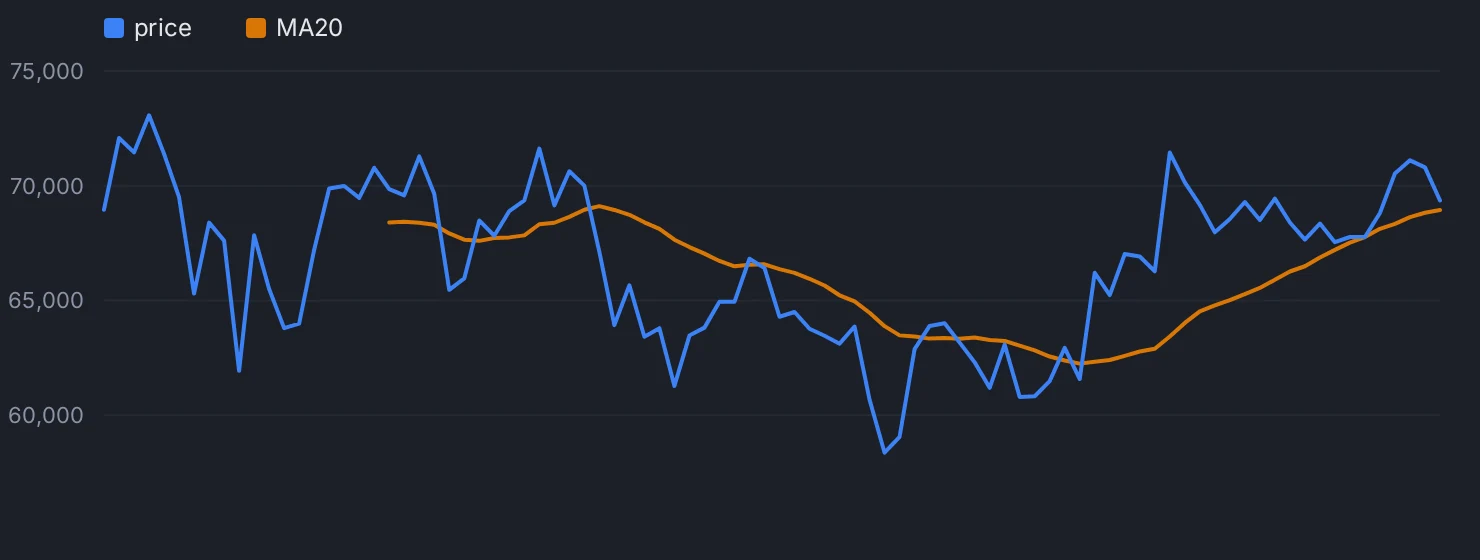
What they cannot do
They cannot tell you a turn is coming. Nothing computed only from past closes can. A moving average will turn down after price turns down, every time, without exception.
They cannot tell you a level will hold. Price touching the 200-day average is not information about what happens next. In a strong trend, that touch gets bought. In a regime change, it gets sliced. The line looks identical in both cases while it is happening.
And they perform badly in ranges. Inside a sideways market, price crosses the average constantly and every cross looks like a signal. This is the single largest source of losses for people trading crossovers: the tool is a trend tool, applied to a market that is not trending.
SMA, EMA, and why the argument is mostly noise
An exponential moving average weights recent bars more heavily, so it reacts sooner. People spend a lot of energy on this choice.
In practice, the difference between an SMA and an EMA of the same length is small compared with the difference between a 20 and a 200. Length dominates type. If your results swing wildly when you switch from SMA to EMA, or from 50 to 55, you have not found a better setting - you have found evidence that the edge was never stable enough to survive a small change.
Test that deliberately. A parameter that only works at one exact value is a warning, not a discovery.
Using the lag on purpose
The honest way to use a lagging tool is to give it a job where being late is acceptable.
Classification is such a job. So is staying in a position: a trailing rule anchored to volatility or to a long average keeps you in a move longer than your instincts would, precisely because it is slow to react. Being late out of a trend that is still running costs you very little. Being late into a range costs you repeatedly.
A moving average is a smoothed record of where price has already been. It describes. It does not forecast. Once you stop asking it to predict, it becomes a much more useful line on your chart - and you stop paying for the crossovers that were never signals in the first place.
A moving average is a smoothed record of where price has already been, so it can describe a trend but can never predict one.
Check yourself
Replay six months of daily bars on one asset and record every time price crossed its SMA50, marking each as trend continuation or false signal, then compare the two counts.
Bar replayIndikora has a free simulator, bar replay and a behavioral coach that reads your own trades.
Open the app