
Breakouts, and why most of them fail
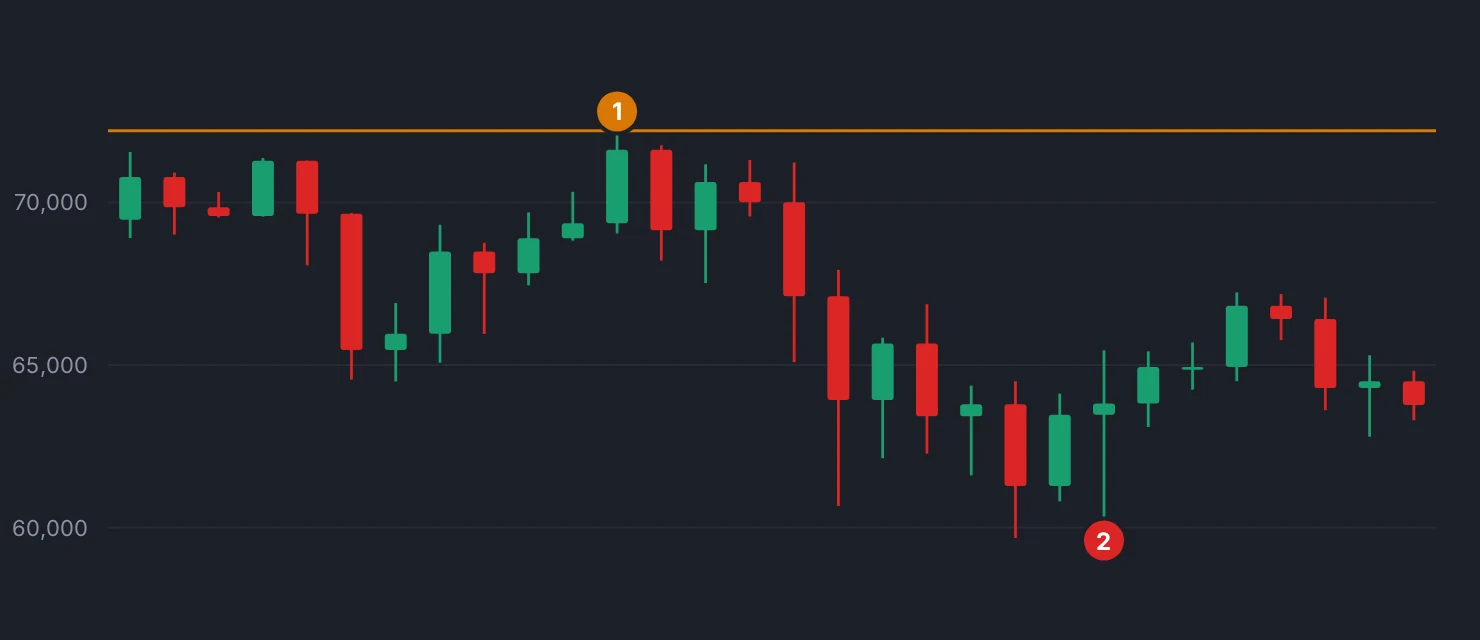
Price presses against a level it has failed at three times. It clears. You enter, and within two days you are back inside the range, watching the move you bought roll over. If this has happened enough times, you have probably concluded that breakouts are a trap set for people like you.
Half right. Most breakouts do fail, and that is not evidence of a rigged market or a bad method. It is the base rate. Well-run breakout systems routinely win 30% to 40% of their trades. The question is never how to stop losing on breakouts. It is whether the structure of your wins and losses tolerates losing that often.
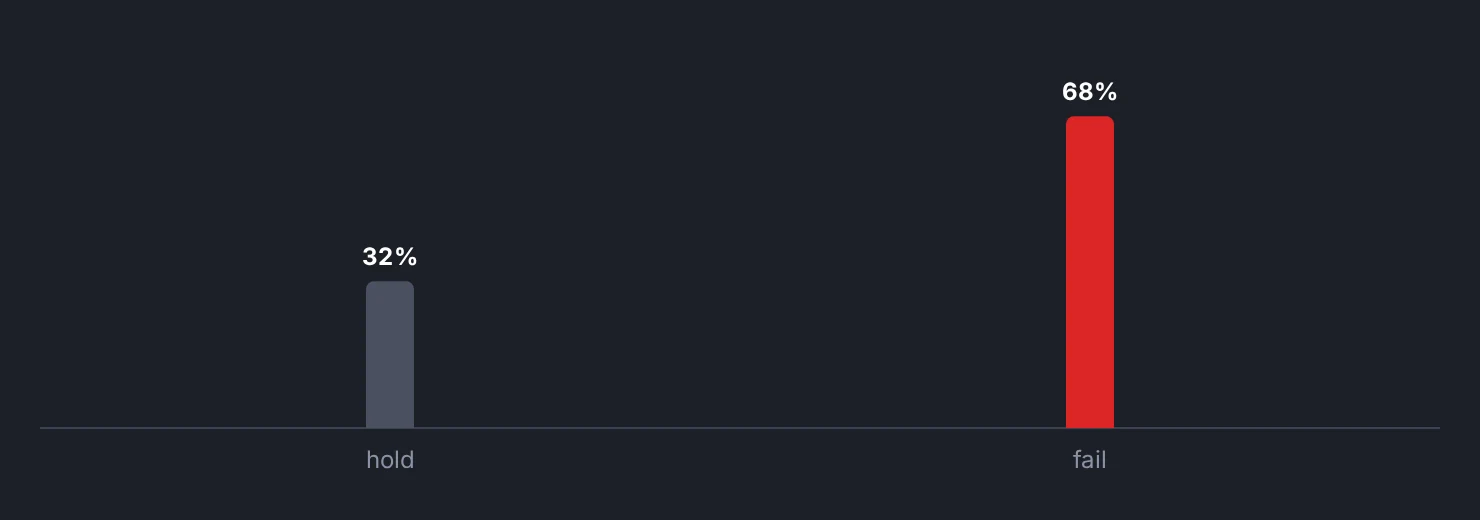
Why the failure rate is structurally high
A range exists because two groups disagree about value and neither can force the issue. The edges of that range are where resting orders pile up: stops from people positioned inside, and entry orders from people waiting for a break.
A move through the level triggers all of those orders at once, which produces movement regardless of whether anyone has changed their mind about value. That is the key mechanic. The initial thrust past a high is partly mechanical, and mechanical movement has no follow-through built into it.
Follow-through requires new participants entering after the level is cleared, for their own reasons, at worse prices. When that happens, the break holds. When the mechanical orders exhaust and no one else steps up, price falls back inside and the people who bought the break become the next round of sellers - which is why failed breakouts often reverse hard in the opposite direction.
The market does not need to be hunting you for this to happen. The order book does it automatically.
The environment decides the odds
The same breakout entry has completely different odds depending on what came before it.
A break out of a long, quiet compression inside an existing trend behaves differently from a break out of a wide, choppy range going nowhere. In the first case, the surrounding structure is already making progress, so the break is a continuation of something. In the second, there is no directional force, so the break has nothing to continue.
This is the trend-or-range classification doing real work. Applying breakout entries indiscriminately across both environments is how the failure rate goes from "high but workable" to "consistently unprofitable."
Indikora's version of that filter is mechanical: an asset is only eligible when daily price is above SMA50 and 28-day momentum is positive. It does not attempt to trade breaks in assets that are not already trending on their own daily chart.
The arithmetic that makes a losing majority profitable
Take 100 trades at a 35% win rate, risking 1R each, with average winners of 3R and losers of 1R.
- 35 wins x 3R = 105R
- 65 losses x 1R = 65R
- Net = 40R
Now change one number. Cut the winners to 1.5R because you took profit early on the ones that were working, and the same 100 trades produce 52.5R minus 65R, a net loss of 12.5R. You did not lose more often. You simply stopped letting the winners pay for the losers, and that alone flipped a profitable structure into a losing one.
This is the single most common way breakout traders destroy their own edge. The losses feel like the problem, so they tighten entries and take profits sooner, both of which attack the wrong side of the equation.
What actually separates the survivors
They size for the base rate. If 6 or 7 out of 10 lose, strings of five losses are ordinary. At 0.5% risk per trade, a five-loss string costs about 2.5% of equity, which is annoying. At 5% risk it costs 25%, which is career-ending. The sizing decision is what determines whether you are still trading when the winner arrives.
They have a mechanical exit for the winners. A trailing rule such as a chandelier stop at 3 x ATR below the highest price since entry keeps you in a move past the point where you would have taken profit manually. It gives back part of the peak on every exit, and that is the cost of capturing the occasional move that runs far.
They accept re-entry. A break that fails and then re-breaks a week later is a new trade, not a continuation of an old grievance. Refusing it because the first attempt hurt is the most expensive form of memory in trading.
The honest framing
Breakout trading is a method for capturing rare large moves at the cost of frequent small losses. If that trade-off does not match your temperament, that is a real and legitimate finding about you, and it is better discovered on paper than after eleven consecutive losers.
What you cannot do is keep the frequent small losses while also cutting the rare large winners short. That version of the method has no path to profitability, no matter how well you pick your levels.
Breakout methods lose most of their trades by design, so they only work when the rare winners are allowed to run far past the size of a loser.
Check yourself
Replay one asset for six months, mark every break of a prior twenty-bar high, and record the win rate and the average size of winners versus losers in R.
Bar replayIndikora has a free simulator, bar replay and a behavioral coach that reads your own trades.
Open the app