
Spread, slippage and fees: the invisible tax
Open a position and close it one second later, having changed nothing. You are down. Not because you were wrong, but because there is a toll booth between you and the market, and it charges on the way in and on the way out.
Charts do not show this. Your equity curve does. The gap between what a strategy looks like on paper and what it does live is very often just cost, and cost is the one variable in trading that is completely predictable in advance.
The spread is the first thing you pay
There is no single price for anything. There is a bid, which is the highest anyone will pay right now, and an ask, which is the lowest anyone will sell for. The difference is the spread, and it is the market maker's compensation for standing between buyers and sellers.
When you buy at the ask and immediately sell at the bid, you have paid the spread. On a major currency pair in the middle of the London session that might be 0.01% of the trade. On a small-cap altcoin at 3am it can be 0.5% or worse.
Two things widen the spread, and they usually arrive together: low liquidity and high uncertainty. This is why the spread on almost everything blows out in the seconds around a scheduled economic release, and why the quiet hours are more expensive than they look. The lesson "Liquidity and sessions: when a market is really open" covers when those windows are.
Slippage is what the spread becomes when you are in a hurry
The spread assumes your order is small enough to fill at the top of the book. Slippage is what happens when it is not, or when price moves between your click and your fill.
Slippage is asymmetric, and the asymmetry works against you. Your entries slip when you chase, and your stops slip when price is moving fast in the direction you did not want. On a calm day it rounds to nothing. On the days that decide your year, it does not.
This is where the choice between a stop-market and a stop-limit stops being academic. One accepts slippage in exchange for certainty of exit, the other refuses slippage and accepts the risk of no exit at all.
Commissions, and the two-sided ones people forget
Explicit fees are the easiest part because someone tells you the number. Stock brokers charge per share or per trade. Crypto exchanges charge a maker fee for orders that rest in the book and a taker fee, usually higher, for orders that remove liquidity. Many forex brokers charge nothing explicit and widen the spread instead, which is a fee wearing a hat.
The costs that catch people are the ones that accrue while you do nothing. Holding a leveraged position overnight incurs financing, because you borrowed to open it. Crypto perpetual futures charge a funding rate every few hours, paid from one side to the other, which can run to double-digit annualized percentages when positioning is crowded. Hold a position for three weeks and that is no longer a rounding error.
The arithmetic that matters
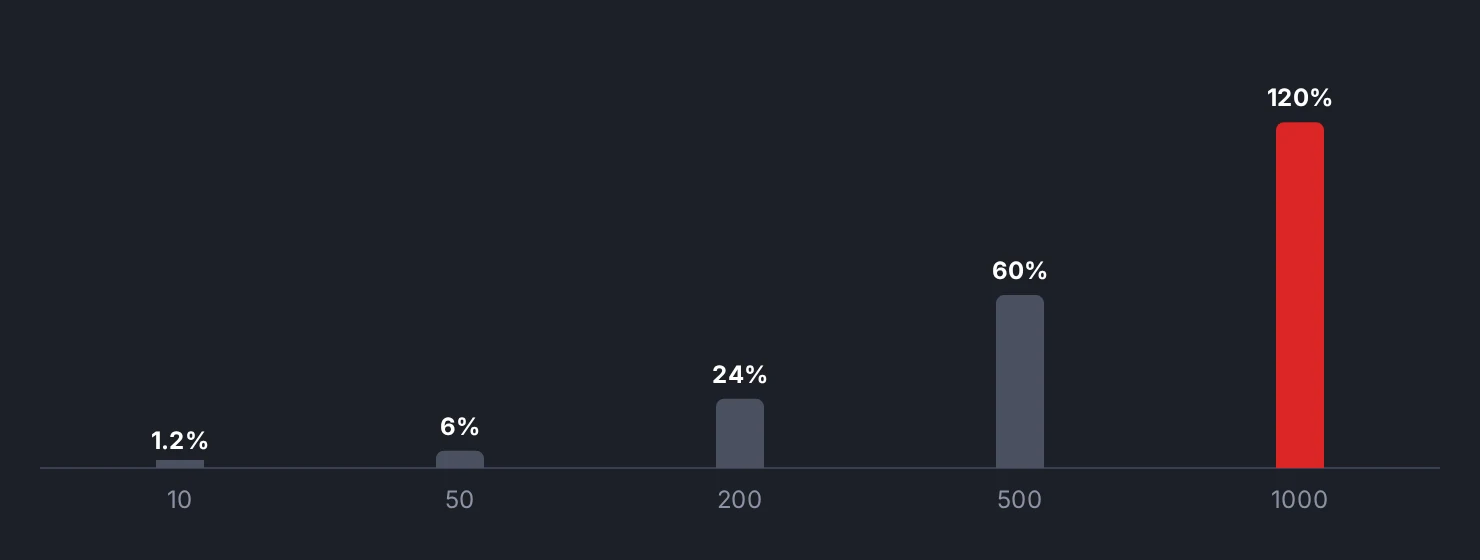
Take a round-trip cost of 0.2%, which is unremarkable for a retail crypto trade with a taker fee on both sides plus a little slippage.
Trade once a week and you pay about 10% of your capital per year in costs. Trade five times a day and you pay well over 200%. Same skill, same setup, same account. The only thing that changed is frequency.
This is the mechanism behind the most-repeated statistic in retail trading, that the large majority of active accounts lose money. It does not require anyone to be an idiot. A strategy with a genuine 0.15% average edge per trade is profitable in a backtest that ignores costs and reliably negative once 0.2% comes out of every round trip.
It also explains why increasing your trade count is the most expensive way to try to fix a losing month. Costs scale linearly with activity. Edge does not.
What to actually do about it
Measure your real cost per trade rather than the advertised one. Take the price on screen when you decided, compare it to your actual fill, add the fee, and do the same on the exit. That number is your true round-trip cost, and it is usually larger than the fee schedule suggests.
Then compare it to your average winning trade. If your typical winner is 0.4% and your round trip is 0.2%, half your gross profit is going to the toll booth before you make a single mistake.
Indikora's approach is relevant here for one structural reason: it is built around daily-timeframe trend conditions and a volatility-based trailing exit, which produces a small number of positions held for a long time. That is not a claim about returns. It is a statement about how many times the toll booth gets to charge you.
The uncomfortable summary is that cost is the only part of your results you control completely. You cannot choose to be right. You can choose how often you pay to find out.
Every trade starts at a loss equal to your costs, and the size of that loss scales with how often you trade, not how well.
Check yourself
Go through your last ten closed trades and log the decision price, the actual fill, and the fee for both entry and exit, then total the round-trip cost as a percentage of the average winner.
Trade journalIndikora has a free simulator, bar replay and a behavioral coach that reads your own trades.
Open the app