
Indicator overload: why adding more makes you worse
The chart starts clean. Then a loss happens that an oscillator would have avoided, so an oscillator gets added. Then a whipsaw that a longer average would have filtered, so that goes on too. A year later there are nine indicators, three panels, and a rule that four of them have to agree, and the results are worse than when there were none.
This is close to universal, and the reason is not lack of discipline. Each addition was a rational response to a specific past loss, and the sum of rational responses to past losses is a system fitted to the past.
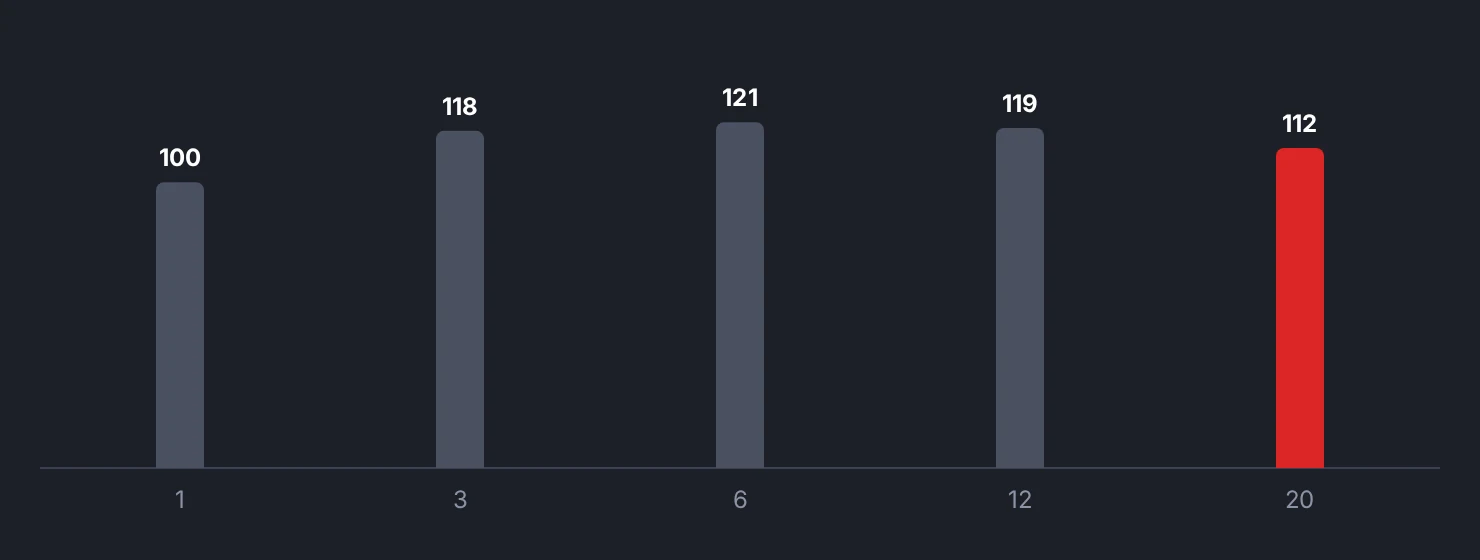
Almost all of them read the same number
Open the formulas. A moving average is a mean of closes. MACD is the difference between two means of closes, with a third mean on top. RSI is a ratio built from close-to-close changes. Stochastics compares the close with the recent high-low range. Bollinger Bands are a mean of closes plus a standard deviation of closes.
Every one of those is a transform of the same daily close series. They are not independent witnesses. They are one witness, asked the same question in five accents.
That is why they usually agree, and why the agreement feels like confirmation. When your trend indicator, your momentum indicator, and your band indicator all turn up together, nothing has been corroborated. One input moved and five functions of it responded.
Genuine independence would require different inputs: price, order flow, funding, positioning, macro data, cross-asset behavior. Even then the correlation during stress is higher than people expect.
What each new parameter costs
Every indicator carries settings, and every setting is a degree of freedom you can adjust after seeing results.
Suppose you test a system with two parameters over 500 trades. Now add three indicators, each with two parameters. You have gone from 2 knobs to 8, and the number of combinations you could search has exploded into the millions.
With enough combinations, something will look excellent on your history by chance alone. That is not a metaphor. Search a large enough space against a fixed dataset and you are guaranteed to find a configuration that performed beautifully, whether or not any relationship exists.
The tell is fragility. A robust rule degrades gracefully when you nudge the settings - 45, 50, and 55 all work roughly as well. A fitted rule collapses. If your equity curve depends on 47 rather than 50, you have found a property of your sample, not of the market.
Complexity feels like work, which is the trap
There is a real psychological pull here. Adding an indicator is concrete, immediate, and feels like progress after a losing week. Sitting with a simple system through a drawdown feels like doing nothing.
But most of what separates profitable traders from unprofitable ones is not on the chart. Position sizing, consistency of execution, whether the plan gets followed on the fourth loss in a row - none of that improves when you add an oscillator, and complexity actively makes it worse by giving you more places to find a reason to deviate.
A system with nine inputs also has nine excuses. There is almost always one that says wait, and one that says go, so on any given day you can construct support for whatever you already felt.
What a small system buys you
You can tell why a trade happened. With three rules, a loss is attributable. With nine, it is not, so you cannot learn from it and you end up adjusting on vibes.
You can tell when it stops working. A simple rule has a measurable expectation. Deviation from it is visible within a reasonable number of trades. Complex systems produce results that are always partly explainable by one component or another, so they never clearly fail - they just quietly stop paying.
You can actually execute it. A rule you can state in one sentence gets followed at 11pm after a bad day. A nine-condition checklist gets approximated, and an approximated system is not the system you tested.
Indikora's eligibility test is deliberately two conditions on the daily: price above SMA50 and 28-day momentum positive. The exit is one rule - a chandelier stop at 3 x ATR below the highest price since entry. The complexity in the platform sits in risk management, regime filtering and calibration, not in the number of indicators, and every published signal is SHA-256 hashed and chained so the record of how it performed cannot be revised later.
How to strip it back
Turn everything off. Add one indicator and define exactly what decision it makes. Then, before adding a second, answer one question: what does this measure that the first one does not.
If the answer is "it confirms the first one," that is a reason to leave it off, not a reason to add it. Confirmation from a correlated source is not evidence. It is the same evidence, counted twice, and the confidence it produces is the expensive kind.
The goal is not minimalism for its own sake. It is that a system you can understand is a system you can evaluate, and a system you can evaluate is the only kind you can improve on purpose rather than by accident.
Most indicators are transforms of the same price series, so stacking them multiplies confidence without adding a single new piece of information.
Check yourself
Remove every indicator from one chart, keep only price and a single moving average, replay three months of bars, and record whether your trend-or-range calls got worse without the extra panels.
Bar replayIndikora has a free simulator, bar replay and a behavioral coach that reads your own trades.
Open the app